Tune Hasura Performance
Configuration and Deployment
Tweak Postgres configuration
PostgreSQL's basic configuration is tuned for wide compatibility rather than performance. The default parameters are very undersized for your system. You can read more detail of configuration settings at PostgreSQL Wiki. There are also config generator tools can help us.
- Tuning Your PostgreSQL Server
- Config generator: https://pgtune.leopard.in.ua
Hasura configuration
HASURA GRAPHQL PG CONNECTIONS
- Environment variable:
HASURA_GRAPHQL_PG_CONNECTIONS - Minimum 2 connections
- Default value: 50
- Max connections: = Max connections of Postgres - 5 (keep free connections for another services, e.g PGAdmin, metrics tools)
However, how many connections is best settings? Of course, it depends on Postgres server's hardware specification. Moreover, too many connections don't mean query performance will be highest. There are many great articles that analyze deeper on this:
- https://brandur.org/postgres-connections
- https://github.com/brettwooldridge/HikariCP/wiki/About-Pool-Sizing
There isn't silver bullet for all server specs. You developer has to test and benchmark carefully for final result. However, at a start point, you can estimate with this formula, then test around this value:
connections = ((core_count * 2) + effective_spindle_count)For example, you server has 4 Core i7 CPU and 1 hard disk should a connection pool of: 9 = ((4 * 2) + 1). Call it 10 as a nice round number.
For high transaction applications, horizontal scale with multiple GraphQL Engine clusters is best practices. However, you should aware of total connections of all nodes. The number must be lower than max connections of Postgres
HASURA GRAPHQL CONNECTIONS PER READ REPLICA
- Environment variable:
HASURA_GRAPHQL_CONNECTIONS_PER_READ_REPLICA
With Read-replica, Hasura can load balancing multiple databases. However, you will need to balance connection between database nodes too:
- Master connections (
HASURA_GRAPHQL_PG_CONNECTIONS) now are used for write only. You can decrease max connections lower if Hasura doesn't write much, or share connections with another Hasura nodes. - Currently read-replica connections use one setting for all databases. It can't flexibly configure specific value for each node. Therefore you need to aware of total connections when scaling Hasura to multiple nodes.
HASURA GRAPHQL LIVE QUERIES MULTIPLEXED REFETCH INTERVAL
- Environment variable:
HASURA_GRAPHQL_LIVE_QUERIES_MULTIPLEXED_REFETCH_INTERVAL
*(Can skip it if you don't use subscription)*
Default: 1000 (1 second)
In brief, live query subscribers are grouped with same query and variables. GraphQL Engine just need to execute one query and return same results to clients once every refetch interval.
The smaller interval is, the faster update clients receive. However, everything has a cost. Small interval with large number of subscriptions need high CPU and memory resources. If you don't really need too realtime, the interval can be set longer a bit. In contrast, with small-medium number of subscriptions, default value (1 second) is good enough
HASURA GRAPHQL LIVE QUERIES MULTIPLEXED BATCH SIZE
- Environment variable:
HASURA_GRAPHQL_LIVE_QUERIES_MULTIPLEXED_BATCH_SIZE
*(Can skip it if you don't use subscription)*
Default: 100
Imagine there are 1,000,000 subscribers that subscribe same query. Emit to million of websockets in sequence can cause delay and eat more memory in long queue. However, small batch size can increase number of SQL transactions. This value needs to keep balance. If you don't have idea to determine what value, just use default value
Scale Hasura
Hasura GraphQL Engine binary is containerized by default, so it is easy to scale horizontally. You need to estimate concurrent requests/second, benchmark how many requests 1 Hasura node can load, then scale multiple nodes with simple calculation:
total_nodes = required_ccu / requests_per_node + backup_nodebackup_node is 0 or 1, depending on your plan
However, you need to aware of total Postgres connections. Default HASURA_GRAPHQL_PG_CONNECTIONS value is 50, meanwhile default Postgres max_connections configuration is 100. Postgres server will easily be out of connections with 3 Hasura nodes, or 2 nodes with events/action services that connect directly to the database.
pg_max_connections >= hasura_nodes * hasura_pg_connections + event_nodes * event_pg_connectionsScale PostgreSQL Servers
Hasura GraphQL Engine is a query engine that utilize power of database, so performance of Postgres directly affects Hasura performance. However, it isn't easy to do if you don't have much Database Admin knowledge. Moreover, there are many Postgres extensions and scaling tools. you don't have idea what tool to use, and does it work well with Hasura.
I did some experiment to test and compare popular tools here, and can give you some opinion tips:
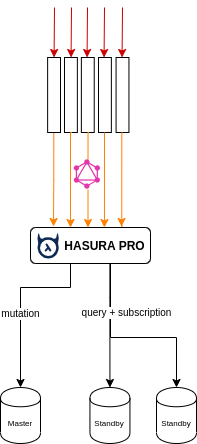
- Easiest way is using Cloud SQL Services (GCP, AWS, Azure...). Cloud Providers can ensure high availability with extra cost. Hasura Pro supports load balancing with Read-replica, utilize master-standby databases's performance easily with one line of config. You can also use PgBouncer proxy over Postgres databases if require too many connections.
- In contrast, high availability is critical on-premise servers. However, with the help or Docker Swarm/Kubernetes, deployment work is easier. IMO, you can easily deploy high availability and load balancing Hasura stack with
repmgrandHasura Pro. However, it is safer if you use 1 master + 2 standby cluster. - If you don't like Hasura Pro, you can use another load balancer such as PgPool II or HAProxy + PGBouncer stack. However, it takes extra works to setup, and has more server cost. IMO, extra server cost won't be cheaper than Hasura Pro.
You can read more detail about Postgres at scale here
Monitoring
Monitor tools help us track and alert error issue, performance and hardware usage. It is very critical on production. There are many open source and commercial services. However, sometimes you have to combine many tools because of architecture complexity.
Hasura
Hasura logging is well structure, in JSON format. It is easy to integrate with Log analytics and monitor services such as Datadog, Google Cloud Logging, Amazon CloudWatch Logs through Docker/Kubernetes logging drivers.
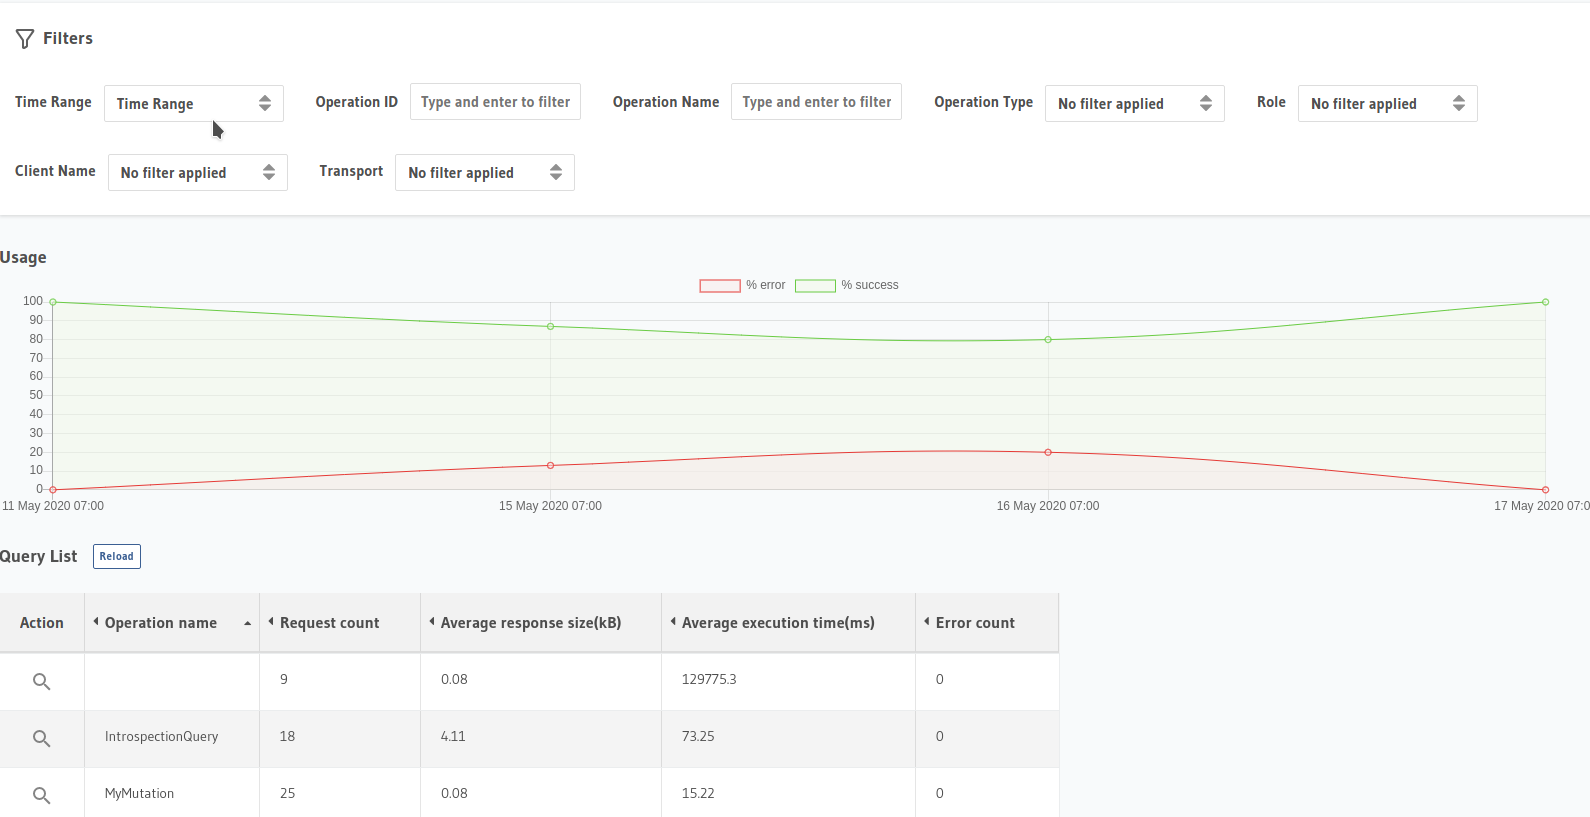
Hasura Pro also provides Metrics monitor that analyzes operations, errors and performance with friendly interface
Server + Postgres
- If you use cloud services (GCP, AWS, Azure...), they provider built-in metrics of server usage (CPU, RAM, network...).
- On premise servers, we can use open source docker services such as cAdvisor, or commercial services such as okMeter
- With Postgres, we can use pgMonitor, pgwatch2 or commercial okMeter
Software Architecture and Best Practices
Hasura as Data service
Connection Pooler
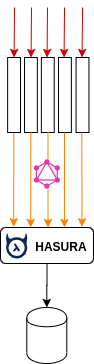
Database connection management isn't easy task, especially when scaling to multiple application nodes. There are common issues such as connection leaking, maximum connections exceeded. If you use serverless applications for actions/event trigger that connect directly to database, connection leaking is unavoidable, because every invocation may result in a new connection to the database, especially when the number of services are grown to hundreds.
We can use many solution such as PgBouncer, vertical scaling and increase max_connections on Postgres configurations. However, increasing too many connections can backstab your server, affect performance.
Therefore, we can reduce connection usage by querying data from GraphQL Engine instead. Connection polling will be centralized in Hasura nodes.
You can read more in Hasura Blog
Load Balancer (Pro)
Read replica on Hasura Pro can load balancing master and standby nodes. Therefore it can be easy-to-use alternative of PgPool or HAProxy.
Understand your data
Hasura's query performance relies on Database performance. When there is any performance issue, you need profiling to check bottleneck point, and optimize your database queries. Utilize power of Postgres can help boosting application speed.
Fundamental knowledge you should know and practice:
- Index your table
- Optimize queries with view, materialized view, and functions
- Use trigger to update data instead of using 2 or more request calls
- Normalize data structure
- EXPLAIN, ANALYZE
Query tips
- Avoid too many
_orconditions. It doesn't utilize table index like,ilikeis expensive, especially on long text. Use Full text search instead- Pagination is necessary.
- Fetching batched multiple queries in one request is useful. However, you shouldn't overuse it. One common case is using aggregate count with data in same pagination query. It is okay for small to medium tables. However, when table size is large, the query will be slow because of entire table query scan
- Avoid joining too many tables.
Microservices
Hardware has its limit. You have to throw much money to scale servers as well as data optimization. Moreover, Postgres doesn't support master-master replica, so it will be bottleneck if we store all data in one database. Therefore, you can divide you business logic to multiple smaller services, or microservices.
Hasura encourages microservices with Remote Schema. It can take responsibility as an API Gateway that route to multiple smaller GraphQL servers.
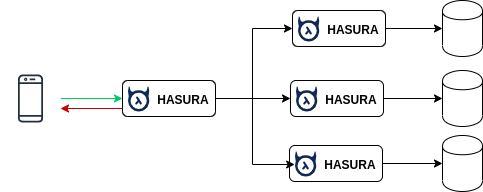
For example, for an e-commerce application, you can design 3 Hasura services:
- User + Authentication
- Product management
- Order + Transactions
The design philosophy is flexible depending on project scope. On small size project, one database can be good enough. The downside is remote schemas can't join data to each other. However, it will be gone after remote-join PR are merged
Postgres ecosystem
Thank to open source community, Postgres has many extensions for various type of applications:
- Time-series data, metrics, IoT: TimescaleDB, CitusDB
- Spatial and geographic objects: PostGIS
- Image processing: PostPic
With remote schema, we can use Hasura with multiple databases for various use cases, for example, Postgres for user data, TimescaleDB for transaction logs, and Postgis for Geographic service.
Summary
Optimization and scaling are complicated work that require the combination of server architecture and software design. We have to keep monitoring, profiling, and refactoring step by step. Postgres is single point of failure. GraphQL Engine is on application level, and it can't automatically optimize database for us.
Hope this guide can help you using Hasura better at scale.